author:
ŠKORPÍK, Jiří – LinkedIn.com/in/jiri-skorpik
issue date:
September 2024
title:
Thermodynamics of turbocompressors
proceedings:
provenance: Brno (Czech Republic)
email: skorpik.jiri@email.cz
Copyright©Jiří Škorpík, 2006-2024 |
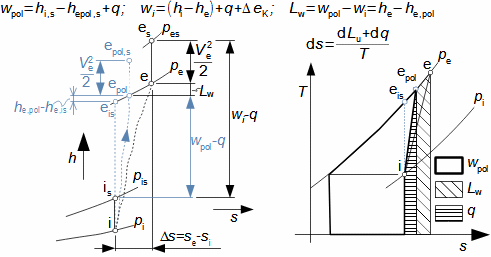
Compression in turbocompressorCompression ratioThe characteristic feature of compression in a turbocompressor is the continuity of the process of transformation of work into pressure and internal energy of a working gas. The basic requirement is to increase the pressure, or achieve the required compression ratio (see Equation 1), with a minimum increase in temperature, which increases significantly, especially if the compression is not cooled. 1: Compression ratio of compressor p [Pa] pressure; ε [1] compression ratio. The index i indicates the state at the inlet to the turbocompressor, the index e indicates the state at the outlet of the turbocompressor.When investigating a compression process, it is necessary to distinguish between single- and multi-stage compression. Both compressions require a little different approach to understanding the causes of losses and an approach to determining measures to reduce them. Adiabatic compressionThe adiabatic compression computational model is used in cases where no significant effect of heat exchange with the turbocompressor surroundings is expected. Isoentropic compressionOutlet velocityThe ideal internal work of adiabatic compression corresponds to that of isentropic compression. In ideal compression, the same outlet velocity is usually expected as in actual compression. This means that the actual machine must have a slightly larger flow area than an ideal machine because the heat loss increases the specific volume of the working gas. Additional lossesLoss heatInternal workh-s chartT-s chartLossesA characteristic feature of real compression is the so-called additional losses Δ. These losses are equivalent to the extra work that has to be added due to the increase in the specific volume of the working gas caused by the loss heat. Figure 2 shows an example of compression in a compressor or its stage in h-s and T-s charts. While in the h-s chart only the losses as a whole can be distinguished, in the T-s chart the individual types of losses can be distinguished. |
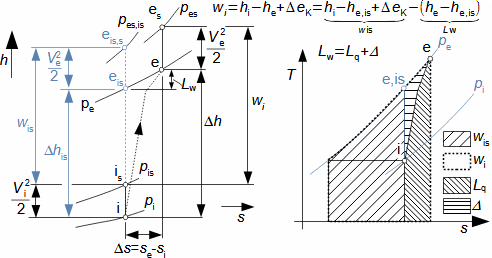
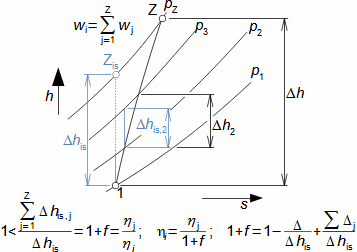
2: Internal work of turbocompressor at adiabatic compression in h-s and T-s charts Lq [J·kg-1] loss heat ([Škorpík, 2024]); ΔeK [J·kg-1] kinetic energy difference between inlet and outlet (usually insignificant difference); h [J·kg-1] enthalpy; Δh [J·kg-1] enthalpy difference; Δhis [J·kg-1] enthalpy difference at isentropic compression; Lw [J·kg-1] internal losses in compressor (extra work input to stage compared to is. compression); s [J·kg-1·K-1] entropy; T [K] absolute temperature; V [m·s-1] velocity; v [m3·kg-1] specific volume; wi [J·kg-1] internal work; wis [J·kg-1] internal work at is. compression; Δ [J·kg-1] additional losses. The index is denotes the isentropic compression states, the index s the stagnation state. The T-s chart is constructed at insignificant ΔeK. These equations are derived in Appendix 5.Multi-stage compressionInternal efficiencyInternal efficiency of stagePreheat factorA typical characteristic of the internal efficiency of multi-stage compression ηi is that it is smaller than the mean internal efficiency of the individual stages ηj, see Figure 3. The cause is due to additional losses. Thus, it is clear that the internal losses in the compressor stage degrade the efficiency in the following stage. The ratio of the mean value of the internal efficiency of the individual stages ηj to the internal efficiency measured between the first and the last stage ηi is called the preheat factor 1+f, see Problem 1. 3: Multi-stage adiabatic compression |
1+f [1] preheat factor; Z [-] number of stages; Δj [J·kg-1] additional losses per stage; ηi [1] internal compression efficiency between points 1-Z. The index j indicates the j-th stage. The equations are derived for the assumption that all stages process the same enthalpy gradient and the compression is adiabatic. For clarity, the kinetic energy of the absolute velocity is not plotted in the figure. These equations are derived in Appendix 6.
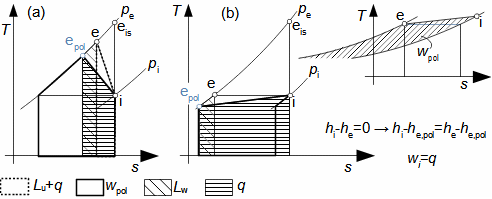
Polytropic compressionReversible polytropic compressionHeatingIn some cases, compression is affected by heat exchange with the compressor surroundings. For example, when the compressor is purposely cooled, or when cryogenic gas that is heated by the surrounding surroundings is compressed. In such cases, the compression is similar to polytropic compression - the comparative ideal compression in this case is reversible polytropic compression. Polytropic compression is described by Equations 4. These equations can be derived from the equation of the first law of thermodynamics. 4: Internal work of compressor for case q>0 q [J·kg-1] heat exchanged with surroundings; Lu [J·kg-1] dissipated amount of energy, or the sum of different types of energy transformed into internal energy of gas during compression. The index pol indicates reversible polytropic compression. In the figure, the case q>0 (heat input - if he, pol-he,is>0, then this is the sum of the heat input and the additional losses due to heat input). The T-s chart is constructed when the difference in kinetic energies is insignificant.CoolingFor completeness, the compression heat rejection cases are shown in Figure 5. |
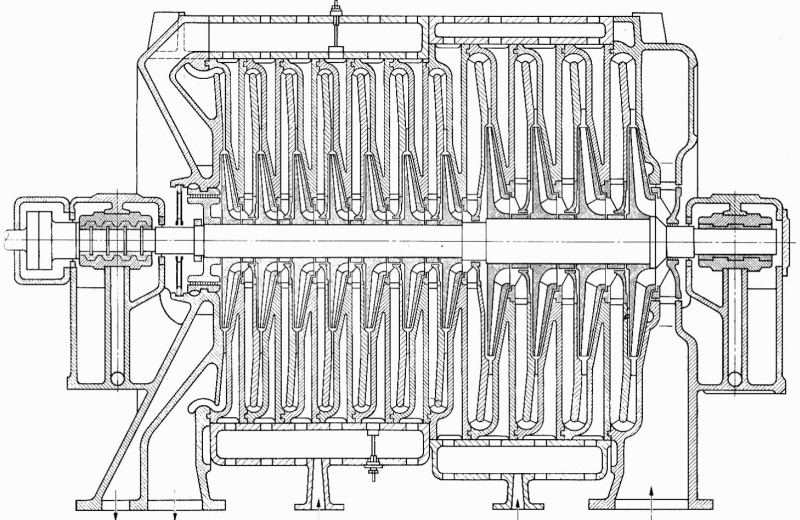
5: Internal workings of compressor for case of cooled compression (a) case for Lw<-q; (b) case when Te=Ti (apparently isothermal compression - in this case temperature of cooling medium must be lower than temperature of working gas at inlet to compressor Ti). If he,pol-he,is<0, then this is the sum of the heat rejected and the work saved due to the compression cooling. A T-s diagram is constructed when the difference in kinetic energies is insignificant.Energy balanceInternal efficiencyWhen creating energy balances for polytropic compression, it is necessary to define the work in reversible polytropic compression wpol. Often the work of reversible isothermal compression is used as wpol, especially if the compression is cooled, see Problem 2. In particular, the work of compression with heat input is compared with the work of isentropic compression wis. In presenting the internal efficiencies, it is necessary to indicate which process has been selected as the comparison process in order that the efficiency value may have a telling value. Turbocompressors cooling performanceCompression cooling is the most effective way to reduce compressor internal work, with several methods to achieve it. The compressed gas during compression can be continuously cooled, either by casing cooling or by injecting coolant into the compressed gas. However, cooling can also be done discontinuously in stages by means of so-called intercooling. However, each cooling generates a new type of loss, so that effective cooling can only be done under certain conditions. Casing coolingRadial stageCasing cooling can be done on twin-casing compressors, with coolant flowing between the casings to cool the working gas inside, see Figure 6. Casing cooling compressors are complicated and expensive - channels are required and there is a risk of coolant leakage into the compressed gas at the dividing plane and vice versa. |
6: Turbocompressor with eleven radial stages and with casing cooling Made by Demag.AirCasing cooling is a low efficiency method and so is used for compressors with low compression in one stage, for single stage compressors and blowers it is the only way to cool the compression. On the other hand, its low efficiency allows it to be used for cooling even moist air containing dust, provided that the compressor surface temperature does not drop below the dew point of the air. Cooling by coolant injectionBy injecting coolant into the working gas stream, the gas is cooled due to evaporation of the coolant. The rate of evaporation and therefore cooling depends, among other things, on the relative heat transfer surface of the coolant and the working gas, so the injection nozzles (Figure 7) are designed to have as much dispersion as possible. A certain distance is required for evaporation and therefore radial stages are preferable for injection cooling (coolant is injected at a point behind the stator blades towards the return channel to the next stage). In the case of axial stages, the gap between the stages would have to be increased at the injection point. |
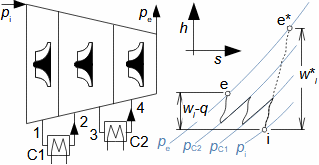
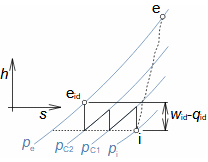
7: Principle of compressor coolant injection nozzle AirAmmoniaThe amount of coolant depends on the pressure, the required temperature and the composition of the resulting mixture after cooling. For example, if the compressed gas is air, only enough cooling water can be injected to keep the relative humidity of the air below 100 % after evaporation, otherwise water droplets will remain in the air. In ammonia compression, liquid ammonia is used, in nitrous gas compression, a low nitric acid solution is used, etc. MoistureThe disadvantage of this method of cooling is that the compressor discharge gas contains some moisture. This means that the use of such gas is limited to applications where moisture in the gas is not a barrier to its use. In particular, these are processes where the vapours contained in the gas may condense. For example, when used in pneumatic actuators, etc. IntercoolingMulti-stage turbocompressorThe heat exchange with the surroundings does not have to be distributed evenly throughout the compression, for example when using intercooling. This consists of taking the compressed gas after selected compressor stages outside the compressor to a heat exchanger (most often consisting of finned tubes) where the gas is cooled by means of a coolant (usually water). For example, in the case of Figure 8, where intercooling is implemented for a three-stage turbocompressor, the entire compression can be divided into 3 separate compressions and the internal work of the compressor can be calculated from the differences in enthalpies and heat rejection, see Problem 3. The advantage of intercooling is also that the work of the individual stages and their working conditions are similar (velocity triangles, temperatures, etc.), but it must be taken into account that the specific volume of gas decreases between stages, therefore the first stage after intercooling will have smaller inlet flow area than the outlet flow area of the previous stage. |
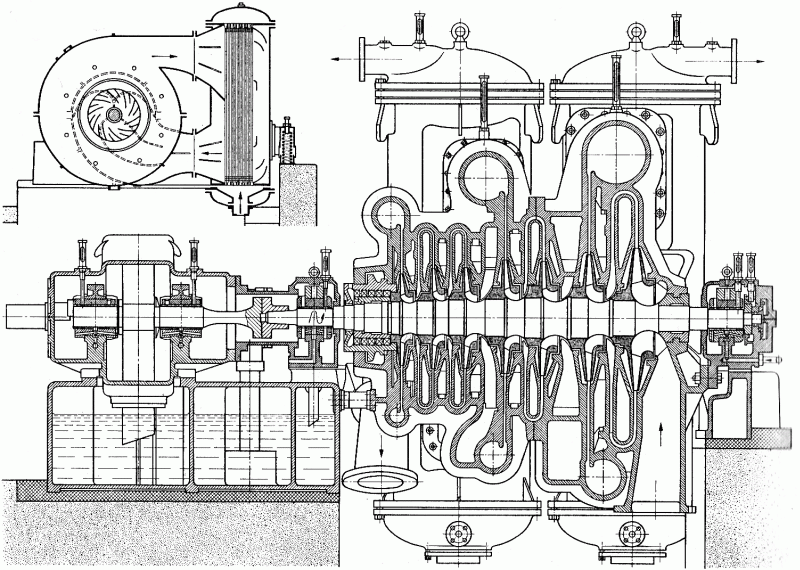
8: Principle of compression with intercooling C-intercoolers; e*-end state of working gas at compressor outlet in case of compression without cooling. pC1, pC2 [Pa] pressure before entering intercoolers; w*i [J·kg-1] internal work of compressor for case of compression without cooling.Radial stageFigure 9 shows an example of a turbocompressor design with seven radial stages and two intercoolers, placed after the second and fourth stages. Note that the intercoolers must also be removed before dismantling the compressor top case (see cross section). There are other design arrangements for easier removal of the compressor - connecting the inlet and outlet of the intercooler through the lower case. In the case of multi-casing turbocompressors, intercooling can be installed in the interconnection between the individual casings. 9: Seven-stage turbocompressor with two intercoolers Made by Escher Wyss. |
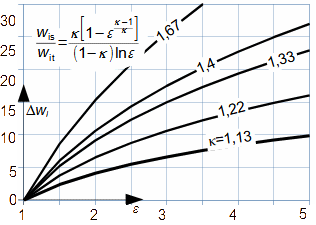
This method of cooling is accompanied by greater design and investment requirements (cooling equipment must be purchased in addition to the compressor) and is therefore usually carried out only from a certain size of turbocompressor or there must be other than economic reasons, such as safety (for flammable gases), gas stability (molecules can dissociate at higher temperatures, etc.). Cooling effectivenessCompressor internal work vs. Pressure lossAir compressionMethane compressionSteam compressionHelium compressionCooling does not always mean a significant reduction in power input. Any cooling affects the thermodynamics of compression (cooling increases the pressure loss, by friction of the fluid against the heat transfer surfaces and by the formation of vortices when injecting coolant, etc.), so there is always a limit to the effectiveness of cooling. As can be seen by comparing the work of isentropic compression with that of isothermal compression, which corresponds to the compression at perfect cooling in the chart in Figure 10. For example, it is clear from the chart or equation that if the increase in the work of air compression due to pressure losses were 10%, then cooling would be positively significant at compression ratios as low as 2, at methane compression as high as 5%, etc. At actual compressions, the work savings are much less, so it pays to start cooling from higher compression ratios than the chart shows. 10: Difference between isentropic and isothermal compression work wit [J·kg-1] work of isothermal compression; Δwi [%] maximum theoretical work saving due to cooling, Δwi=(wis·w-1it-1)100; κ [1] heat capacity ratio of working gas (κ=1,13 for example CH4, κ=1,22 for example C2H4, κ=1,33 for example H2O steam, κ=1,4 for example air, κ=1,67 for example He). The derivation of the equation is given in Appendix 7. |
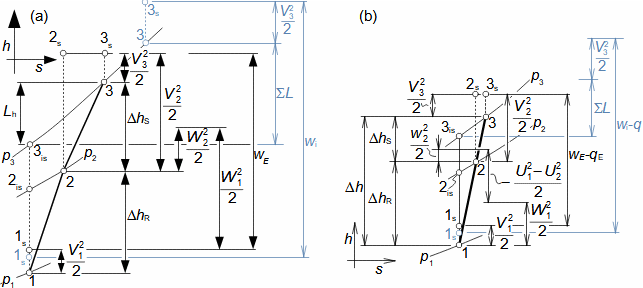
Thermodynamic design of turbocompressor stageJapikse,1997The basic types of compressor stages are reaction axial stage and radial stage. Occasionally, a diagonal design of a single-stage compressor can be encountered. Most stationary applications fall into the radial stage range, only when higher mass flow rates of about 15 m3·s-1 and above are required is the compressor designed as an axial stage, because from such mass flows the efficiency of axial turbocompressors is already higher than radial ones. On the other hand, the intercooling is better implemented with radial stages, which more than compensates for the lower efficiency of the individual stages. Recommended values of dimensionless coefficients for the design of individual stages are given in [Japikse, 1997, p. 1-3]. h-s chartsRotor friction lossFigure 11 shows the h-s chart of the axial and radial compressor stage at the investigated radius. At each radius under investigation, the effect of the heat exchanged qE on the Euler work can be different depending on the type of cooling and the heat from the rotor friction loss. The energy balance of the whole stage is shown in blue. 11: h-s chart of compressor stage on radius r (a) axial stage; (b) radial stage. Lh [J·kg-1] profile losses; qE [J·kg-1] heat exchanged with surrounding of investigated streamline; ∑ L [J·kg-1] internal losses of stage, sum of all losses in stage. The index 1 indicates the condition before the rotor blade cascade.ReactionThe reactions R of the radial stages (centrifugal) are greater than zero, because a zero reaction would, due to centrifugal forces, increase the relative velocity W2, which is well seen in the h-s chart in Figure 11b. |
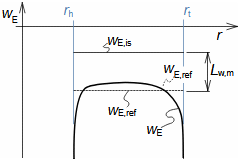
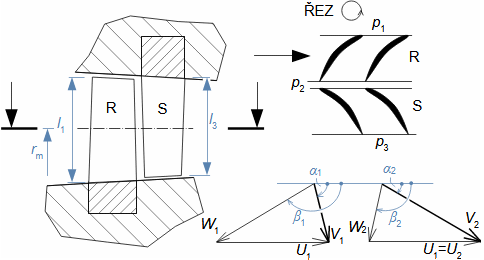
Euler workFlow separationReverse flow lossesFigure 12 shows the expected Euler work wE,ref of the axial stage compressor and the Euler work wE,is for lossless flow. The difference between these works are the profile losses at a given blade radius. The profile losses are highest at the blade edges and therefore the necessary pressure increase cannot be achieved at these points and, on the contrary, flow separation and even reverse flow losses can be expected. The differences in Euler work between the stream core and the blade edges are even greater in the case of straight blades of axial stages and are therefore not much used in compressors. 12: Comparison of Euler work of axial compressor stage in actual and isentropic flow r [m] radius of stage; wE,is [J·kg-1] Euler work during flow without losses; wE,ref [J·kg-1] proposed linear (constant) Euler work partially respecting mean losses of stage; Lw,m [J·kg-1] mean profile losses of stage. The index h denotes the foot radius of the blades, the index t the radius at the blade tips.Turbocompressor bladesAxial stageConical stageAxial or conical compressor stages contain twisted blades, but there are also many cases with straight blades. The h-s chart for a radial stage can also be used in the design of a conical compressor stage, in which the radius of the stage, respectively the length of the blades, decreases due to the decreasing specific volume, see Figure 13 (see the calculation of a conical stage in the article Internal losses of turbomachines and their influence on turbomachine calculation). Due to the thin blades, shroud cannot be used in compressor stages. |
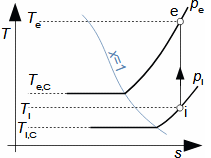
13: Velocity triangle of axial compressor stage R-rotor blade cascade; S-stator blade cascade. l [m] blade length; rm [m] mean radius; U [m·s-1] blade speed; V [m·s-1] absolute velocity; W [m·s-1] relative velocity; α [°] angle of absolute velocity; β [°] angle of relative velocity. The velocity triangle is drawn for a mean radius and a reaction of 0,5.Change in relative humidity at compressionRelative humidityCondensationCompressing moist air increases the pressure of the gases and the steam pressure contained in the air. In adiabatic compression, the steam content will always be in a superheated state at the end of compression, even in the case of saturated air compression. This means that the relative humidity at the end of compression will always be lower than at the beginning and therefore condensation of the steam in the air cannot occur. However, at higher pressures the condensation temperature of the steam in the air will also rise from the initial absolute temperature Ti,C to Te,C, see Figure 14. 14: T-s chart of steam compression in air p [Pa] partial pressure of steam in air; TC [K] absolute temperature of condensation of steam in air at pressure at the start of compression (index i) and at end of compression (index e); x [1] dryness of steam. The figure shows the case of isentropic compression. |
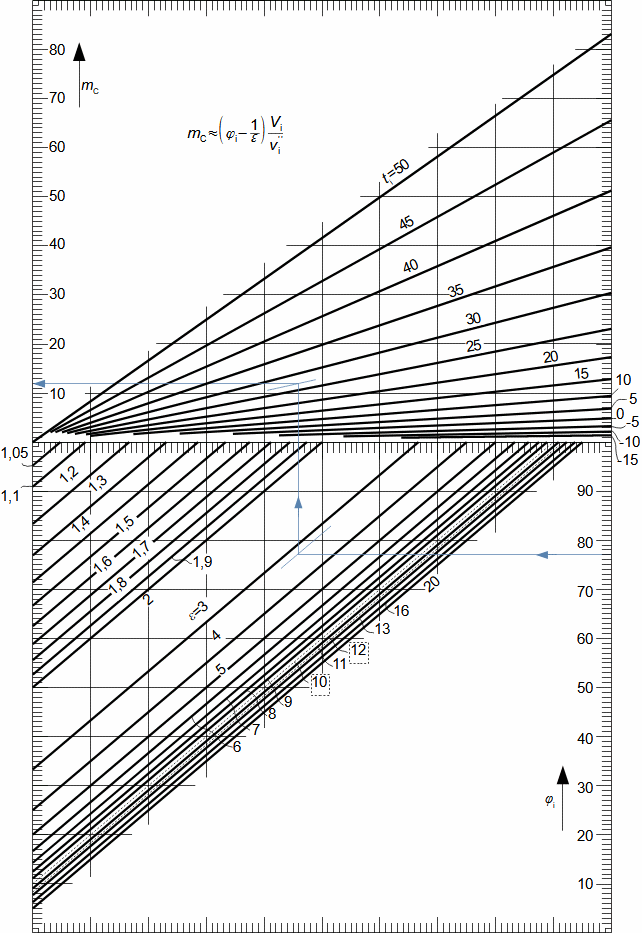
CondensationCondensation of steam in compressed air can occur, for example, in the piping during its distribution to consumers or during its cooling in compressor intercoolers or compressed air storage tanks, etc. In these cases, it is usually assumed that the compressed moist air will be cooled to ambient temperature, i.e. the suction temperature of the compressor Ti. The task of the engineer or designer is therefore to determine whether condensate will be rejected at this temperature and in what quantity according to Equation 15. This equation was derived assuming that the moist air is cooled to the inlet temperature, if the resulting cooling temperature is lower the amount of condensate rejected will be greater. 15: Amount of condensate rejected from compressed and cooled moist air mC [kg] amount of condensate rejected from compressed and cooled moist air back to temperature ti ( negative value means that relative humidity of air at end of compression and after cooling φe will be less than 1 and therefore no condensation will occur); Vi [m3] volume of compressed air measured at inlet; v''i [m3·kg-1] specific volume of saturated steam at inlet temperature ti; φ [1] relative humidity of air. The derivation of this equation is shown in Appendix 8.The specific volume of saturated steam in Equation 15 is a function of temperature v''=f(t), therefore a nomogram can be constructed to determine the amount of condensate rejected from compressed and cooled moist air as a function of inlet temperature, see Nomogram 16. |
16: Nomogram for approximate determination of amount of condensate rejected from compressed and cooled moist air mC [g·m-3]; ε [1]; ti [°C] temperature; φi [%] |
ProblemsProblem 1:
The turbocompressor intakes air at a temperature of 15 °C and a pressure of 0,1013 MPa, the air at the turbocompressor outlet is 293 °C and the pressure is 0,802 MPa. Determine the additional losses, the preheat factor and the internal efficiency ηi. The turbocompressor has 12 stages. The compression is uncooled or consider adiabatic compression. The solution of this problem is shown in Appendix 1.
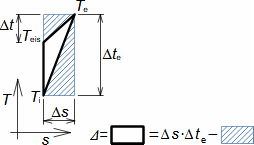
Using linear approximation of thermodynamic changes in T-s diagram to approximate magnitude of additional losses at compression T [K]; t [°C]; s [J·K-1·kg-1]
Symbol descriptions are in Appendix 1.
Problem 2:
Find the internal isentropic, polytropic and isothermal efficiency of a turbocompressor that compresses dry air. The inlet air temperature is 14,34 °C and the outlet air temperature is 480,6 °C. The inlet pressure is atmospheric and the compression ratio is 23. The internal input power of the turbocompressor is 12,6 MW. The turbocompressor is equipped with a casing cooling with a capacity of 0,8 MW. The solution of this problem is shown in Appendix 2.
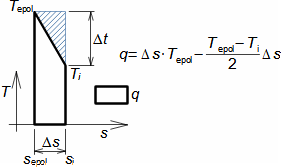
Using a linear approximation of reversible polytropic compression in a T-s diagram to approximate state epol T [K]; t [°C]; s [J·K-1·kg-1]; q [kJ·kg-1]
Symbol descriptions are in Appendix 2.
|
Problem 3:
Find the internal efficiency of the turbocompressor that compresses the dry air. The inlet air temperature is 14,34 °C and the outlet air temperature is 156,6 °C. The inlet pressure is atmospheric and the compression ratio is 23. The internal input power of the turbocompressor is 10,6 MW. The turbocompressor is equipped with two intercoolers at a pressure levels of 0,7 MPa and 1,4 MPa. The cooling capacity of the coolers is 6,5 MW. The solution of this problem is shown in Appendix 3.
Symbol descriptions are in Appendix 3.
Problem 4:
Make a basic design of the rotor dimensions of a single-stage radial turbocompressor with axial inlet. The rotor blades have a radial direction at the outlet, see figure. The dry air parameters at the rotor inlet are: 101,33 kPa, 15 °C. The required pressure from the stator blade cascade is 0,44 MPa. The required mass flow rate is 0,7225 kg·s-1. The solution of this problem is shown in Appendix 4.
ΔWθ [m·s-1] deviation of circumferential component of relative velocity at rotor outlet caused by counter-rotating vortex (slip). |
Symbol descriptions are in Appendix 4.
ReferencesŠKORPÍK, Jiří, 2023, Flow of gases and steam through nozzles, fluid-dynamics.education, Brno, https://fluid-dynamics.education/flow-of-gases-and-steam-through-nozzles.html.
ŠKORPÍK, Jiří, 2024, Technická termomechanika, engineering-sciences.education, Brno, https://engineering-sciences.education/technicka-termomechanika.html.
DIXON, S., HALL, S., 2010, Fluid Mechanics and Thermodynamics of Turbomachinery, Elsevier, Burlington, ISBN 978-1-85617-793-1.
JAPIKSE, David, 1997, Introduction to turbomachinery, Oxford University Press, Oxford, ISBN 0-933283-10-5.
KADRNOŽKA, Jaroslav, 2004, Tepelné turbíny a turbokompresory, Akademické nakladatelství CERM, s.r.o., Brno, ISBN 80-7204-346-3.
©Jiří Škorpík, LICENCE
|